

Slow it Down: Cities with the Most Speeding Tickets
For many motorists, the speedometer becomes an afterthought when they hit the roads. Here’s which cities have the most drivers guilty of speeding.
Seeing a car driving well over the speed limit is a daily occurrence on the streets. Whether the offender is doing it out of necessity because they are late for work, or just driving quickly for the thrill of it, it seems that drivers these days simply can’t slow down. In fact, in a 2017 survey conducted by the National Safety Council, 64 percent of motorists admitted they were comfortable speeding.
Of course, even though exceeding the speed limit is a common sight, it is still against the law. Enough violations can result in a suspended license, and ticketed drivers are hit with hefty fines, and black marks on their driving records. These violations can hurt the wallet in other ways, raising insurance costs for offenders and making it much more difficult to get a cost-friendly plan.
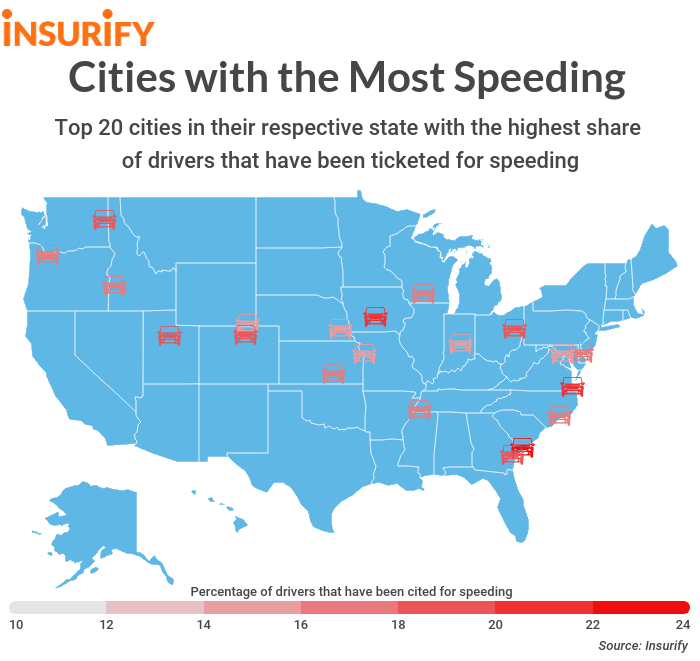
To further investigate speeding in America, data scientists at Insurify, a website to compare car insurance quotes, decided to analyze the numbers to discover which areas are the most guilty of driving too quickly. Here are the 20 cities with the highest proportion of speeding drivers.
Insights
- National averages. Nationwide, 10.27 percent of drivers have at least one speeding ticket. Additionally, 12.43 percent of drivers had a prior accident, while the mean proportion of speeding-related fatalities was 3.58 per 100,000 people.
- A rural problem. Urban areas feature more stop lights and traffic, which theoretically makes it more difficult to speed. The data backs this up. The top 20 list heavily features rural areas. Remarkably, 60 percent of the cities on the list have a population of less than 100,000, and none have more than one million people. In fact, just one of the 35 most populous cities in the U.S. makes our top 20.
- Repeat offenders. The cities with the biggest speeding problems certainly weren’t spread out all over the country. In fact, the 15 cities with the highest proportions of drivers with speeding tickets were concentrated in just three states—South Carolina, Virginia, and Iowa. And two of those states were home to 14 of those 15 cities.
Methodology
To determine which cities have the most speeding drivers, the research team at Insurify, a website to compare car insurance quotes, took a look at some numbers from its database of 1.6 million car insurance applications. To get quotes, applicants enter personal information and driving history, including whether or not they have been ticketed for speeding in the past seven years. The number of drivers with a speeding ticket was analyzed against the total number of drivers in each city to determine the proportion of drivers with a speeding ticket. The top city in each state was then selected and the top 20 are reported here. Additionally, data on the percentage of drivers with a prior accident was also gathered from the Insurify database, while the number of speeding-related fatalities per 100,000 was obtained from data collected in 2017 by the National Highway Traffic Safety Administration (NHTSA). Finally, data on city populations was gathered by the United States Census Bureau in 2017.

20. Indianapolis, Indiana
- Population: 872,680
- Percentage of drivers with a speeding ticket: 14.22%
- Percentage of drivers with a prior accident: 13.46%
- Speeding-related fatalities per 100,000 people (statewide): 3.21
19. Lincoln, Nebraska
- Population: 284,736
- Percentage of drivers with a speeding ticket: 14.23%
- Percentage of drivers with a prior accident: 16.14%
- Speeding-related fatalities per 100,000 people (statewide): 1.89
18. Cheyenne, Wyoming
- Population: 63,624
- Percentage of drivers with a speeding ticket: 14.39%
- Percentage of drivers with a prior accident: 13.25%
- Speeding-related fatalities per 100,000 people (statewide): 4.27
17. Rockville, Maryland
- Population: 68,401
- Percentage of drivers with a speeding ticket: 14.42%
- Percentage of drivers with a prior accident: 15.01%
- Speeding-related fatalities per 100,000 people (statewide): 2.11
16. Kansas City, Missouri
- Population: 488,943
- Percentage of drivers with a speeding ticket: 15.31%
- Percentage of drivers with a prior accident: 10.84%
- Speeding-related fatalities per 100,000 people (statewide): 5.38
15. Gresham, Oregon
- Population: 111,053
- Percentage of drivers with a speeding ticket: 15.41%
- Percentage of drivers with a prior accident: 15.89%
- Speeding-related fatalities per 100,000 people (statewide): 3.47
14. Cordova, Tennessee
- Population: 60,762
- Percentage of drivers with a speeding ticket: 15.68%
- Percentage of drivers with a prior accident: 14.53%
- Speeding-related fatalities per 100,000 people (statewide): 2.75
13. Dover, Delaware
- Population: 37,538
- Percentage of drivers with a speeding ticket: 15.92%
- Percentage of drivers with a prior accident: 11.31%
- Speeding-related fatalities per 100,000 people (statewide): 4.10
12. Jacksonville, North Carolina
- Population: 72,447
- Percentage of drivers with a speeding ticket: 16.25%
- Percentage of drivers with a prior accident: 13.9%
- Speeding-related fatalities per 100,000 people (statewide): 5.58
11. Wichita, Kansas
- Population: 390,591
- Percentage of drivers with a speeding ticket: 16.29%
- Percentage of drivers with a prior accident: 10.97%
- Speeding-related fatalities per 100,000 people (statewide): 3.65
10. Madison, Wisconsin
- Population: 255,214
- Percentage of drivers with a speeding ticket: 17.22%
- Percentage of drivers with a prior accident: accident: 16.52%
- Speeding-related fatalities per 100,000 people (statewide): 3.67
9. Nampa, Idaho
- Population: 93,590
- Percentage of drivers with a speeding ticket: 17.23%
- Percentage of drivers with a prior accident: 13.43%
- Speeding-related fatalities per 100,000 people (statewide): 3.21
8. Orem, Utah
- Population: 97,839
- Percentage of drivers with a speeding ticket: 17.54%
- Percentage of drivers with a prior accident: 14.98%
- Speeding-related fatalities per 100,000 people (statewide): 2.36
7. Hinesville, Georgia
- Population: 33,140
- Percentage of drivers with a speeding ticket: 17.54%
- Percentage of drivers with a prior accident: 11.31%
- Speeding-related fatalities per 100,000 people (statewide): 2.58
6. Spokane, Washington
- Population: 217,108
- Percentage of drivers with a speeding ticket: 17.6%
- Percentage of drivers with a prior accident: 13.57%
- Speeding-related fatalities per 100,000 people (statewide): 2.11
5. Loveland, Colorado
- Population: 76,701
- Percentage of drivers with a speeding ticket: 17.72%
- Percentage of drivers with a prior accident: 14.99%
- Speeding-related fatalities per 100,000 people (statewide): 3.81
4. Canton, Ohio
- Population: 70,909
- Percentage of drivers with a speeding ticket: 17.94%
- Percentage of drivers with a prior accident: 15.4%
- Speeding-related fatalities per 100,000 people (statewide): 2.21
3. Des Moines, Iowa
- Population: 217,521
- Percentage of drivers with a speeding ticket: 20.16%
- Percentage of drivers with a prior accident: 13.8%
- Speeding-related fatalities per 100,000 people (statewide): 3.03
2. Portsmouth, Virginia
- Population: 95,684
- Percentage of drivers with a speeding ticket: 20.47%
- Percentage of drivers with a prior accident: 11.41%
- Speeding-related fatalities per 100,000 people (statewide): 3.06
1. Beaufort, South Carolina
- Population: 13,729
- Percentage of drivers with a speeding ticket: 22.19%
- Percentage of drivers with a prior accident: 14.3%
- Speeding-related fatalities per 100,000 people (statewide): 7.68
More From Good Time Oldies 107.5